data demystified #1: An Introduction to Multilevel Regression and Post-stratification (MRP) and Demographic Sorting

Data for Progress seeks to illuminate the world using the newest techniques in data science and to bring those techniques to the general public. To that end, we'll be featuring blog posts explaining these data science techniques and how they can improve our understanding of the world. Our first blog post comes from Data for Progress co-founder Colin McAuliffe (@ColinJMcAuliffe), introducing the MRP method we use to create state level estimates of public opinion and the implications of demographic sorting for American politics. - Sean
Colin McAuliffe (@ColinJMcAuliffe)
Most polling data covered in the media consists of national toplines and occasional breakdowns by demographics. However, much of politics in the United States is determined by state-level public opinion, due to the Senate, Electoral College and the federalist policy structure. There is considerable geographic polarization in the U.S., and national toplines become much less useful in this context. Since polling of individual states is far more rare than national polling, to get the estimates of state-level opinion we want, we use a technique called Multilevel Regression and Post-stratification (MRP) to generate state-level estimates from national polling results.
This series walks you through how and why MRP works. MRP consists of two steps. First, we fit a multilevel regression model to a survey sample to estimate how likely someone is to hold a particular opinion based their demographic characteristics and the state where they live. A regression model is a statistical model used to analyze the relationships between some observed outcome (in this case, a political opinion) and other characteristics, called predictors. Multilevel regression is an advanced modeling technique that makes efficient use of sample data.
The major advantage of using multilevel models for estimating state-level opinion is that it allows us to incorporate additional information beyond the polling sample into our analysis. For example, past election results, income statistics, crime rates, and any number of other state-level data can help us get reliable estimates of opinion, provided that there is a meaningful relationship between those data and opinion.
The second step in MRP is called post-stratification, where we use our multilevel model to predict the responses of the population of each state. Using the voting eligible population counts from the Census Bureau, which account for differences in the demographics and geography, we post-stratify the survey sample and the population. In a nutshell, the multilevel regression part of MRP lets us estimate reliable relationships between opinion and demographic and geographic characteristics of a survey sample, and post-stratification corrects for differences between the sample and the population.
We’ll discuss local state-level effects in the next post in this series, but one of the main drivers between differences is national and state-level opinion is demographic sorting. Each state has a different breakdown of demographic characteristics such as age, race, income, and education. These characteristics are generally related to a number of different opinions and political beliefs, and therefore, demographic sorting can explain a portion of the geographic polarization that we observe.
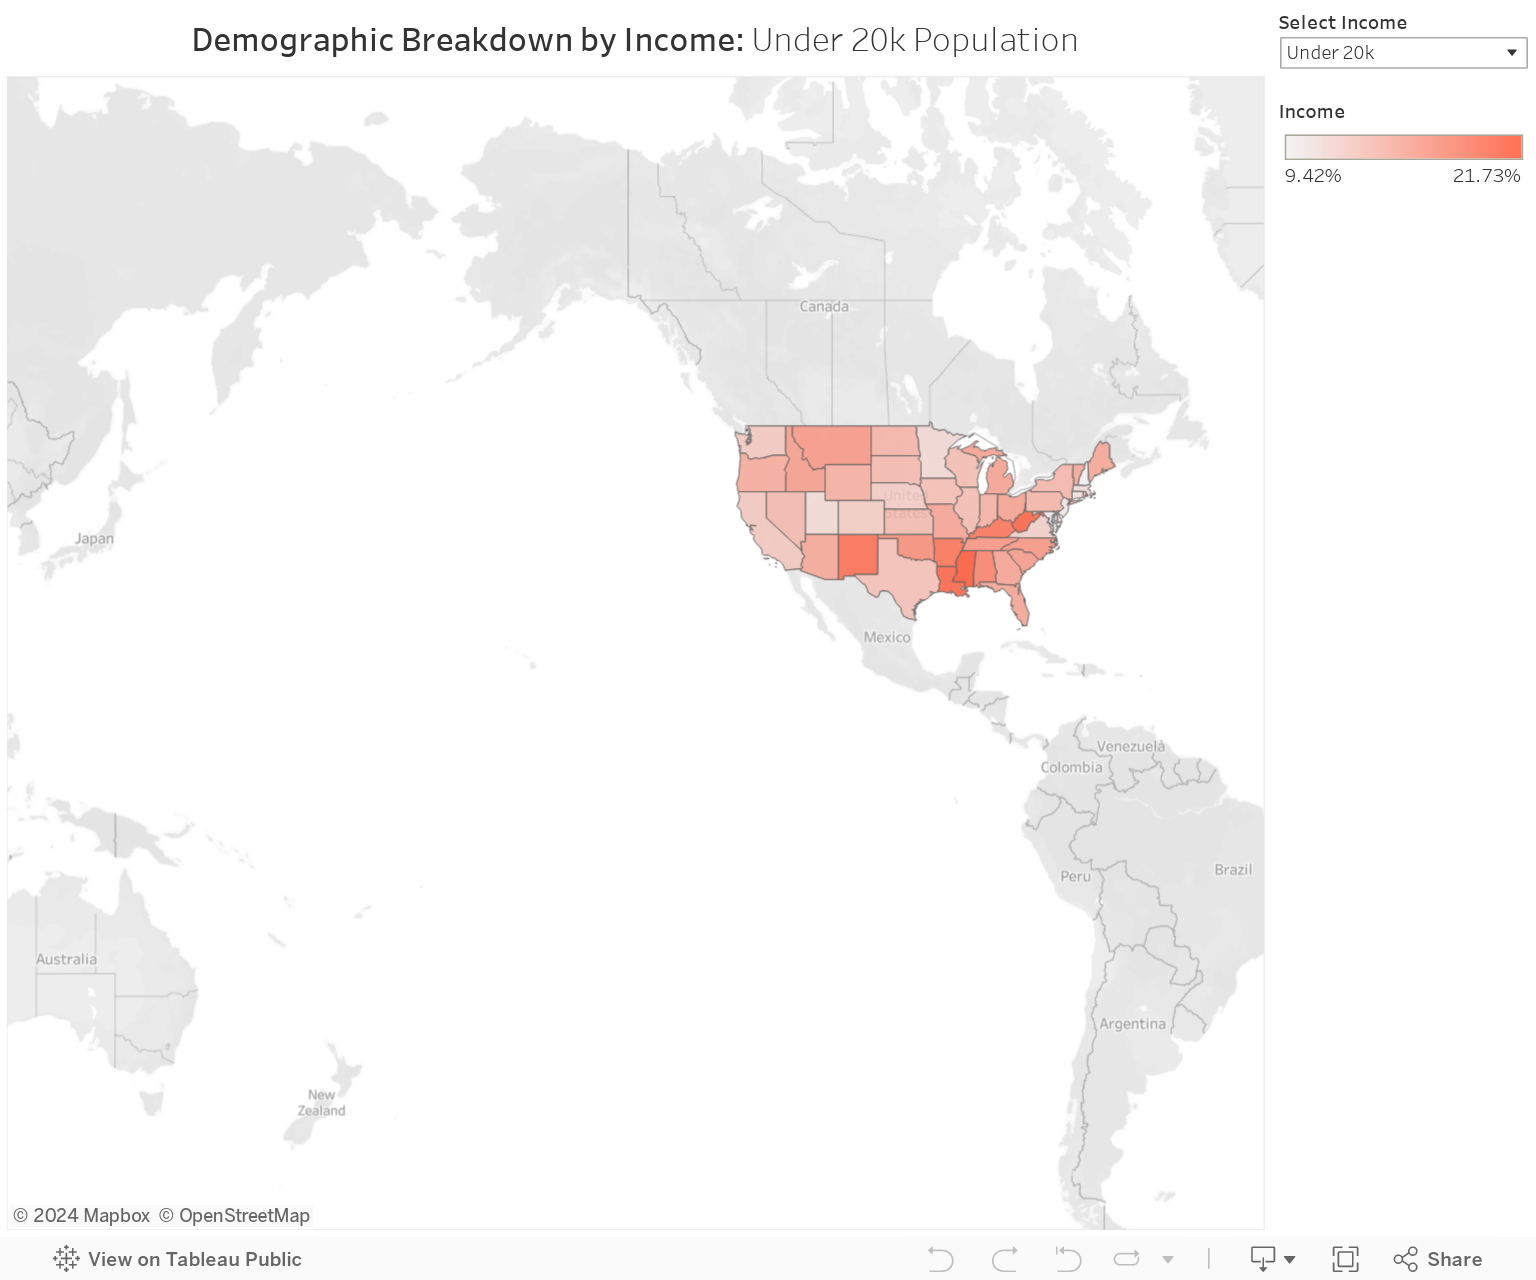
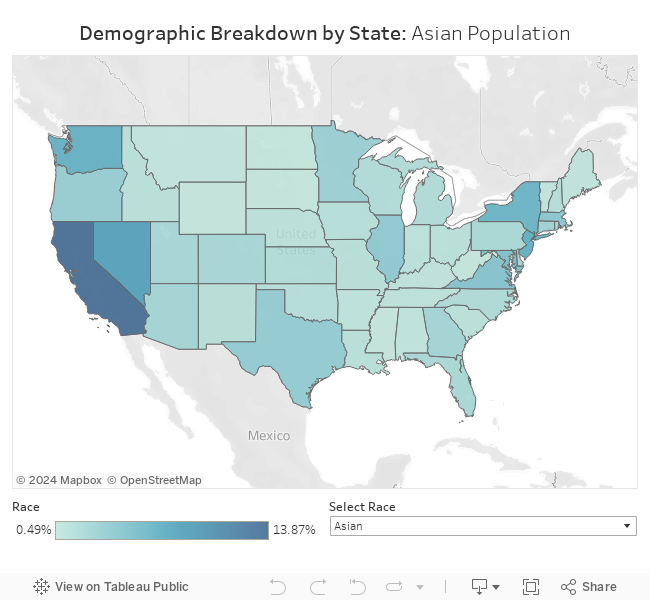
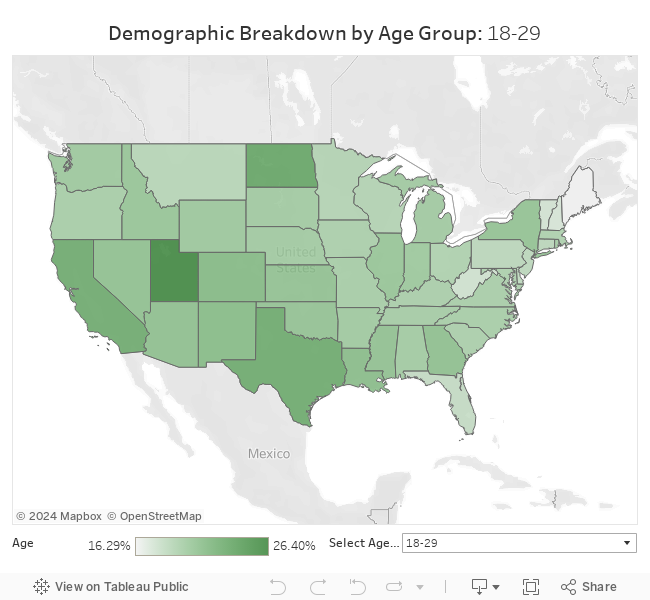
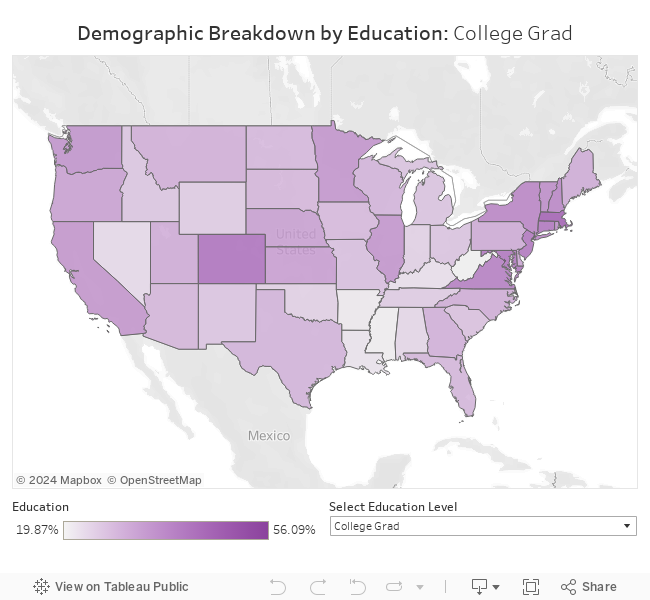
We’ve posted before that anti-immigrant sentiment is most extreme in states without immigrants. We showed that the prevalence of the belief that undocumented immigrants commit more crimes is higher in states with lower levels of recent immigration. This is an example of a state-level trend in opinion that appears to be driven by a significant demographic sorting component. White respondents were much more likely than people of color to hold this belief about undocumented immigrants, and so less diverse states tend to show high overall anti-immigrant sentiment. Demographic sorting clearly isn’t the whole story however, since southern states with relatively high African-American populations show more anti-immigrant sentiment than other more homogenous states. Beyond demographics, we find that states with higher levels of Trump support in 2016 had higher levels of anti-immigrant sentiment. We’ll delve into this further in our next post. For now, you can explore the demographics of the voting eligible population in each state in our interactive map below.