Retaliatory Tariffs and Trump’s Base
By Fabio Votta (@favstats) and Nick Davis (@ntdPhD)
Donald Trump’s recent decision to escalate the ongoing trade war with China resulted in an additional $60 billion in retaliatory tariffs being levied against the United States. While these new tariffs will affect a wide variety of goods that American consumers purchase, his decision further aggravates the plight of American farmers, who have traditionally sold China an enormous amount of soybeans. The trade war has already cost some $9 billion in net farm income since 2018, and crop futures are looking even bleaker after this new round of retaliatory tariffs was announced.
From Vox, to Newsweek, to CBS, to CNN, to local public radio, to even Fox News, almost anyone in the business of popular commentary is arguing that these tariffs are going to have nasty economic impacts. In fact, the situation is so severe that even the Heritage Foundation is raising alarm. It is less clear, however, what this decision and its consequences actually mean for Trump’s political support. It is one thing to note that farmers generally broke for Trump in 2016, but making the case that tariffs will have a negative effect on his political support is difficult without knowing the level of exposure his base faces.
Analysis
To explore that link, we needed data on jobs that were at risk due to tariffs. To that end, in late 2018, Brookings ran an article that explored the extent to which local economies might be affected by the first round of tariffs pushed by the Trump Administration. That data was compiled as part of their “Export Monitor” dataset, which converted tariff data into the Harmonized System format used by the U.S. Census. They kindly shared some of that data with us, which we matched to 2016 county vote returns from Townhall.com in order to calculate the relationship between Trump support and exposure to tariffs.
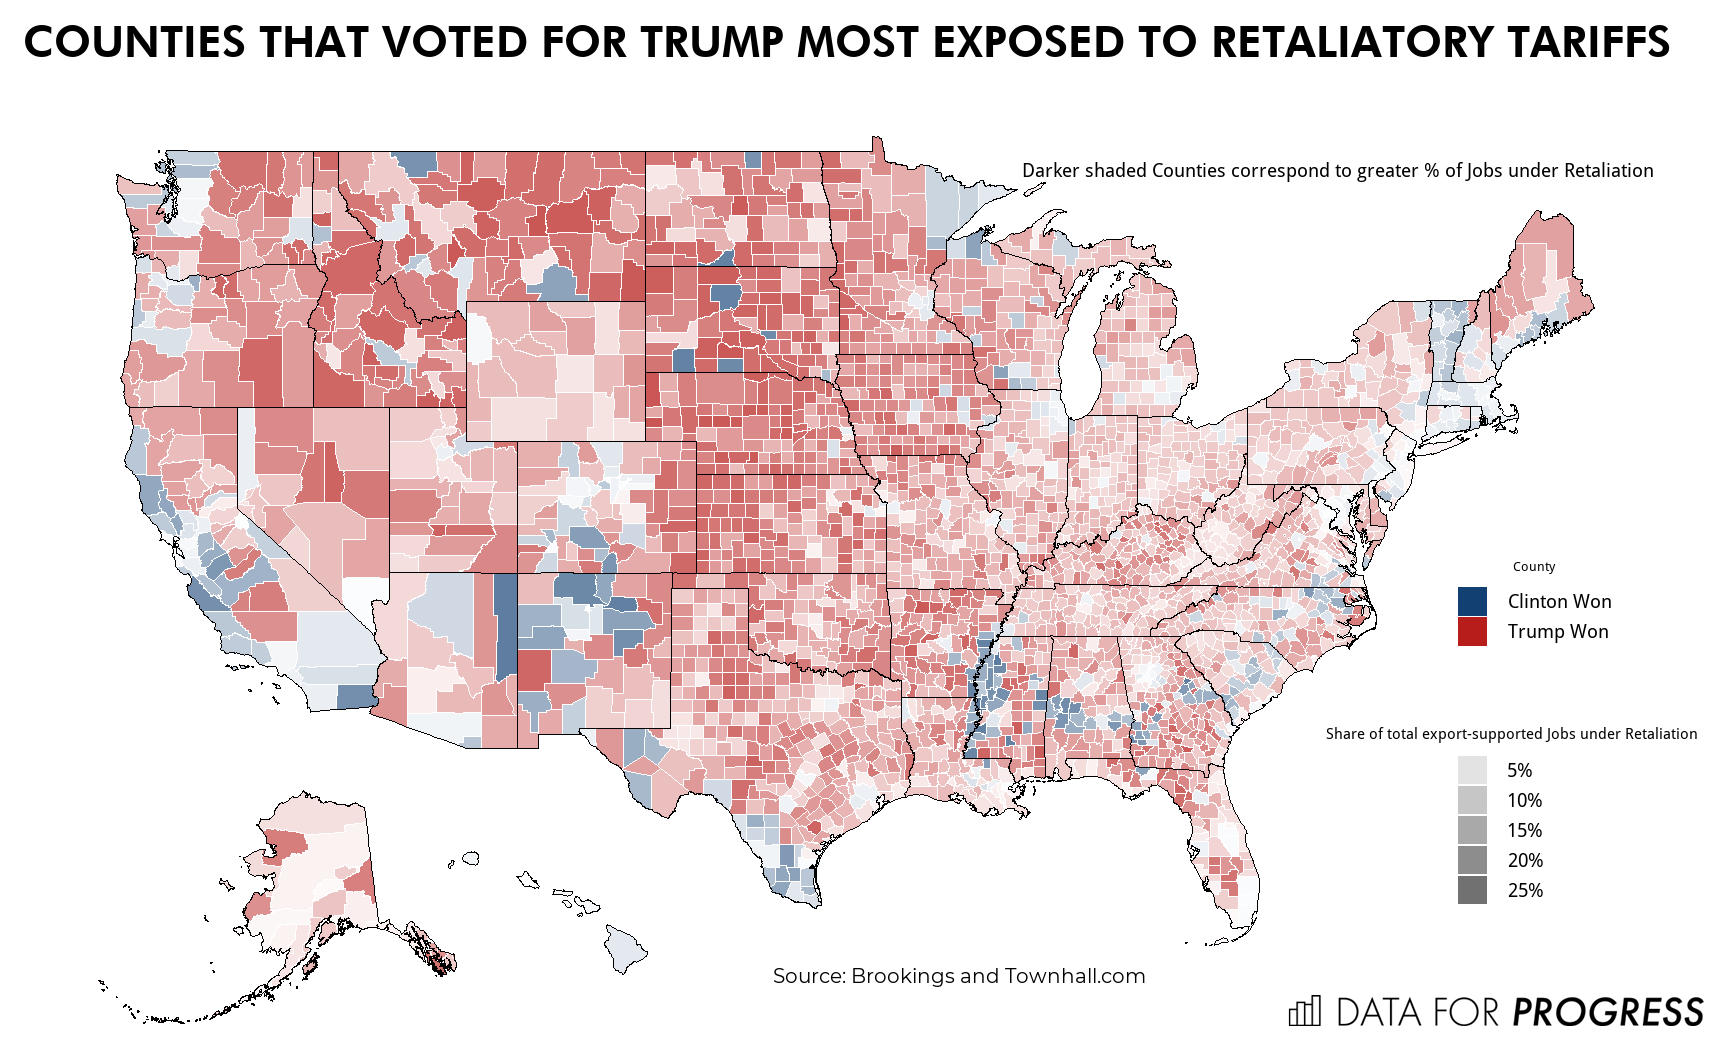
The figure below provides a very high-level portrait of the relationship between counties’ exposure to retaliatory tariffs and presidential voting. Counties that were won by Clinton are shaded blue; counties won by Trump are shaded red. The gradation or depth of color, which corresponds to the shading in the grayscale legend, conveys the percent of jobs that were threatened under retaliatory tariffs in 2018.
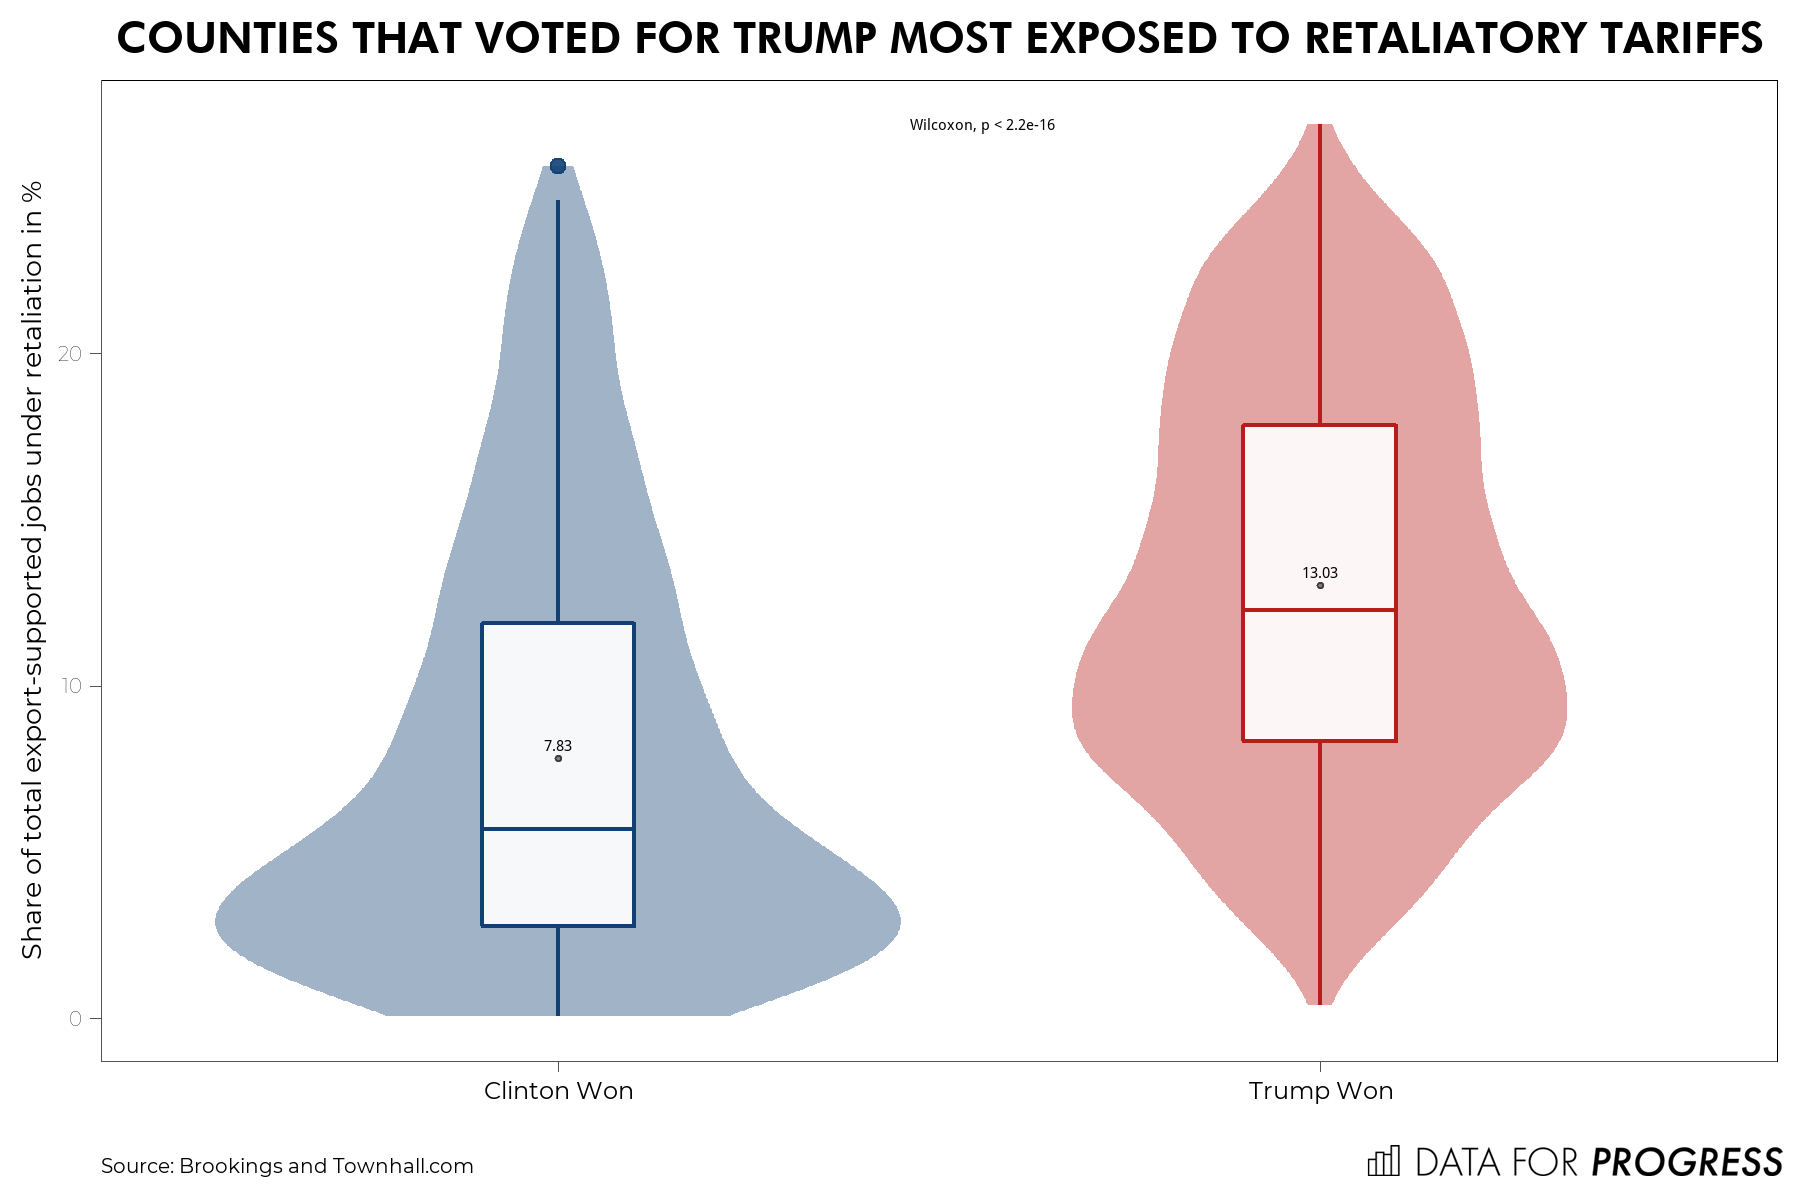
The results look about like you would expect. Many rural communities throughout the heartland that were strongholds for Trump in 2016 now face a significant amount of exposure (i.e. risk to jobs associated with industries targeted by the tariffs). Perhaps unsurprisingly, the differences in exposure vary significantly across the candidates. Trump was more likely than Clinton to carry counties where local economies face greater risk of harm regarding retaliatory tariffs (Figure 2).
Figure 3 plots a scatterplot between Trump vote share and the share of jobs at risk under retaliatory tariffs (Pearson’s r = ~0.4; for a complementary analysis, see also here). What’s noteworthy here is the relationship between Trump vote share above 50% and the share of jobs that are at risk under retaliation. Note the noise in the distribution of counties where Trump won less convincingly (where vote share is ~50% to ~75%) and where Trump won more convincingly (where vote share is above 75%). Simply put, there are a nontrivial number of counties -- some in key swing states like Wisconsin-- where the margin of victory is sufficiently low and the threat of exposure high that this trade war could spell electoral trouble.
To try and push this analysis a bit further, we isolated our analysis to states that were won by Trump with narrow margins in 2016 (i.e. states he carried by less than 5% of the popular vote). Figure 4 is a “waffle” chart that plots exposure to retaliatory tariffs across all of the counties in these states. More than 50% of the counties in these states have at least 10% of jobs at risk due to the tariffs. Counties surrounded by a black box are “competitive” counties (i.e. the margin of victory for Trump was less than 10%; see here for an expanded discussion of district competitiveness). Among those counties, 10 of 16 counties exhibit moderate to high levels of the proportion of jobs at risk. Simply put, partisan voters in these competitive districts could face the serious proposition of either voting to protect their livelihoods or their party’s electoral fortunes. While these are a relatively small proportion of all counties overall, this nevertheless could matter if the margins are as thin as they were in 2016.
Conclusions
The literature on economic voting in political science and economics is large and full of countervailing or contingent results. If presidential approval is endogenous to partisanship (that is, people infer economic assessments on the basis of their partisanship and apply such motivated evaluations to presidential approval), then the extent to which economic conditions affect voting behavior is probably also constrained by similar biases. In other words: people neither approach political nor economic evaluations objectively; both assessments are colored through the partisan lens. As a result, it can be difficult to forecast whether economic harm attributable to the Trump Administration’s actions will translate into losses on Election Day.
Be that as it may, the tariffs are pinching a group of American workers who have already been stretched to the brink. While Trump hammered on trade during the 2016 election and was probably rewarded for it, it is unclear whether and how individuals facing harm due to his decisions will hold him accountable. Still, given the geographic distributions of his base and the livelihoods at risk under retaliatory tariffs, it is not hard to imagine that the longer this situation festers, the more likely it is that it will have some amount of electoral consequences.


