Ambivalent Support: Why Do Primary Voters Say They’ll Vote for a Non-Preferred Candidate?
By Mark White (markhw.com)
Voters can be strategic in who they vote for, especially in a primary election. Voters consider not only who they like best, whose political ideology adheres closest to theirs, and who has a chance to win the primary—they also consider who might be able to win in the general election. Voters, then, might make tradeoffs: While they would really prefer one candidate, they might vote for another. This post looks at when and why 2020 Democratic presidential primary voters might make such a tradeoff.
In a recent Data for Progress/YouGov Blue survey of Democratic primary voters we asked respondents who they would vote for in the primary, if they “had to choose today”; we used this as a measure of vote intention. But this might not be who respondents would really like to be president. To assess support that is less concerned with pragmatic tradeoffs, we also asked participants a “magic wand” question later in the survey:
“Now, imagine that you have a magic wand that could make any of the candidates President. That candidate would not have to compete in the general election, and would automatically become the President. If you could use that magic wand to make any one candidate President, who would you choose?”
I coded any respondents as a “mismatch” if their “vote for” choice was not the same as their “magic wand” choice. The following plot shows support for each candidate, broken out by if it was measured in the “vote for” or “magic wand” question. Magic wand support is displayed with a grey dot and the blue dot shows the pragmatic support level.
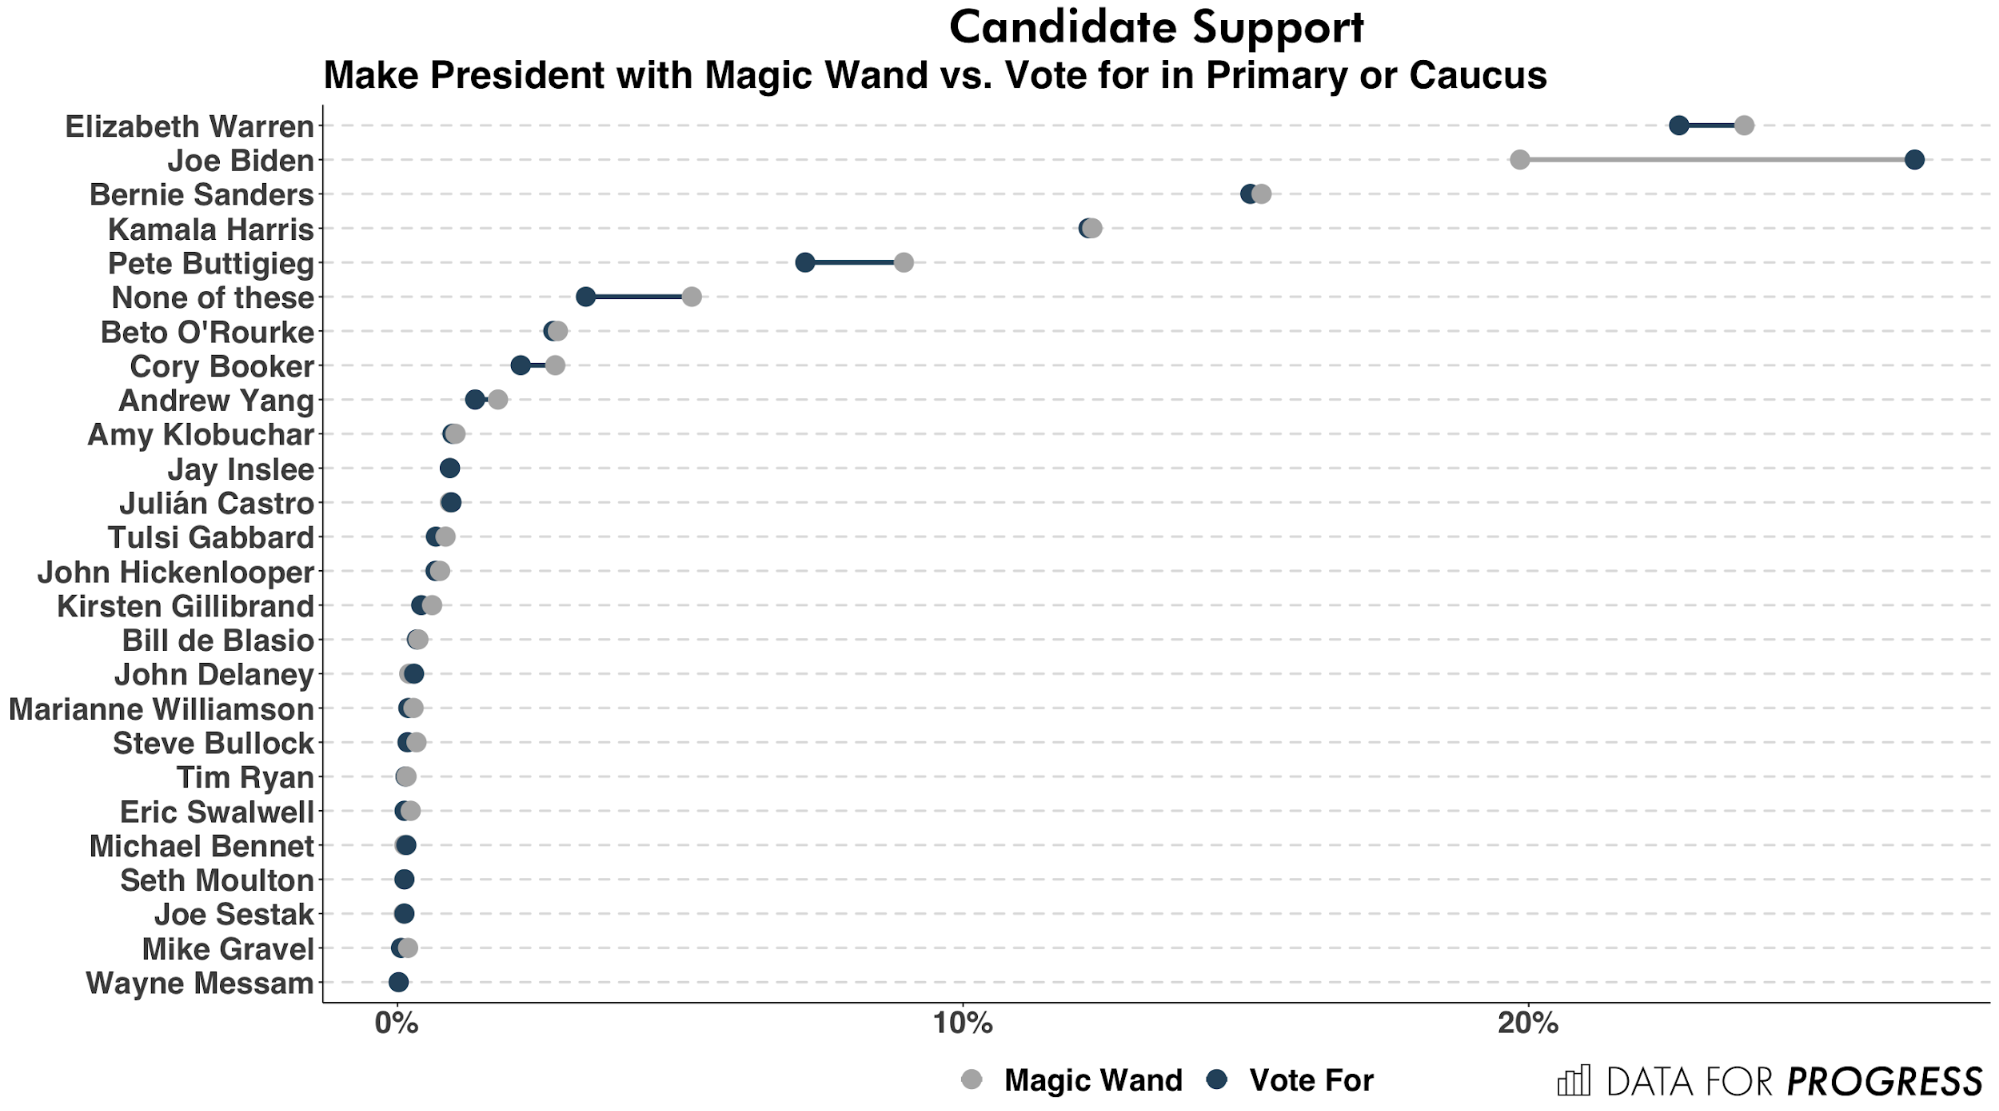
Former Vice President Joe Biden is the only candidate benefitting from strategic considerations; he is the only candidate whose “vote for” support is higher than their “magic wand” support. Considering “vote for” support, Biden (26%) leads Senator Elizabeth Warren (22%); but Warren (24%) leads Biden (20%) on the “magic wand” question. The difference between “magic wand” and “vote for” is significant for Biden, None of these, Buttigieg, and Warren.
In this sample, 27% of likely Democratic primary voters are coded as a “mismatch” — if the election were held now, they would vote for someone other than the candidate they would most like to be president. Of these mismatchers with ambivalent support attitudes, 35% would vote for Biden, 16% would vote for Warren, 13% would vote for Senator Kamala Harris, and 12% would vote for Senator Bernie Sanders. Conversely, 20% of mismatchers would make Warren president with a magic wand, 13% would make Harris, 13% would make Bernie, 12% would make Mayor Pete Buttigieg, and 10% would make someone else outside the field of 25 (at the time of the survey).1
What correlates with mismatching? People might want to vote for a perceived winner—or they don’t want to waste a vote on someone who has no chance. We also asked participants “regardless of who you would vote for… who do you think is most likely to win the 2020 Democratic nomination?” Respondents who predicted that their magic wand candidate would win were mismatchers only 9% of the time, while 41% of those that didn’t predict their magic wand candidate to win were mismatchers. This difference was significant, p < .001. Voters mismatch if they don’t think their ideal, magic wand candidate can win the primary.
What about the general election? We asked respondents:
“Thinking about your priorities, if you had to allocate 100 theoretical ‘points’ among the following candidate characteristics, which would you prioritize?”
We presented respondents with 17 characteristics, like “Candidate is a woman,” “Candidate supports abortion rights, “Candidate has foreign policy experience,” “Candidate is able to connect with rural America,” and so on. One of these characteristics were “Candidate can beat Donald Trump.” There were 111 (4%) respondents who allocated all 100 points to Trump—indicating that this is the only thing they care about in a candidate. These people mismatched 46% of the time, while the rest of the sample mismatched 26% of the time. This difference was significant, p < .001.
I also fit a logistic regression predicting mismatching from the allocator, leaving it as a continuous variable. It was a significant predictor, p < .001, and I plot the predicted probability below of mismatching at each value of the allocator—from assigning 0 points to beating Trump to assigning all 100 to that characteristic.

Winning primary votes is not just about persuading voters that your candidate is likeable, shares your values, or has the best policies. It is also about persuading voters that your candidate can win. These data show that voters might be excited about one candidate, but will vote for someone else if they think they can win—either in the primary or the general.
Democratic voters are considering “electability” when deciding who they want to vote for—about 27% of voters in our sample were planning to vote for someone they did not ideally want to be president. One troubling implication from these findings is that candidates with identities not traditionally associated with being president, such as Warren and Buttigieg, seem to face the biggest penalties associated with these strategic considerations. However, it is still early in the race, and these “electability” perceptions could change as the race progresses.
Methodology:
This survey is based on 2,953 interviews conducted from June 24th to July 2nd by YouGov on the internet of registered voters likely to vote in the Democratic presidential primary in 2020. A sample of 6,116 interviews of self-identified registered voters was selected to be representative of registered voters and weighted according to gender, age, race, education, region, and past presidential vote based on registered voters in the November 2016 Current Population Survey, conducted by the U.S. Bureau of the Census. The sample was then subsetted to only look at respondents who reported they were likely to vote in their state’s Democratic primary or caucus. The weights range from 0.2 to 6.4 with a mean of 1 and a standard deviation of 0.5. Significance tests were performed using the general linear model function from the survey R package, computing standard errors using bootstrapping with 5,000 replicates.
1 These mismatchers whose magic wand was “None of these” tended to be more ideologically moderate than the rest of the sample.
Mark White (markhw.com) is a Senior Political Analyst at YouGov Blue and a senior adviser to Data for Progress. He earned his Ph.D. from the University of Kansas, studying prejudice and political ideology.