Social Security: Warren’s “Plan for That” Enjoys Majority Support Across the Electorate
By Andrew Mangan and Mark White
On September 12, Senator Elizabeth Warren released a plan to expand Social Security for all current and future beneficiaries. Warren’s plan would impose new contribution requirements on income above $250,000 to increase Social Security checks by $200. When you factor in that the current average Social Security check is $1,350, Warren’s plan would increase checks by roughly 15 percent. This increase would be significant given that recent cost-of-living adjustments (COLAs) to Social Security, according to the AARP, “may not adequately cover [beneficiaries’] expenses that rise faster than inflation including health, prescription drug, utility and housing costs.” (Warren’s plan also includes a provision to make COLAs more adequate in the future.) It would help secure the lives of elderly Americans and Americans with disabilities, many of whom survive on fixed incomes.
The plan involves two new contribution requirements on incomes greater than $250,000—which is to say, the top 2 percent of earners in America. The first requirement, a contribution of 14.8 percent, would be on wages, divided between employers and employees, and the second, also 14.8 percent, would be on net investment income. The plan will also extend the solvency of Social Security by “nearly two decades,” according to Warren, and it will close various loopholes that the rich use to escape contributing their fair share.
Warren’s plan stands in stark contrast with President Donald Trump, who has proposed cutting Social Security benefits. And if Trump were to win reelection in 2020, Republicans plan to gut the program, using the deficit as an excuse—despite the fact that Social Security does not add to the deficit.
Because of this, Data for Progress wanted to know what the American voters thought of a plan to increase Social Security payments paid for by taxes on the richest Americans. We surveyed a national sample of 1,006 self-identified registered voters. The first question asked was:
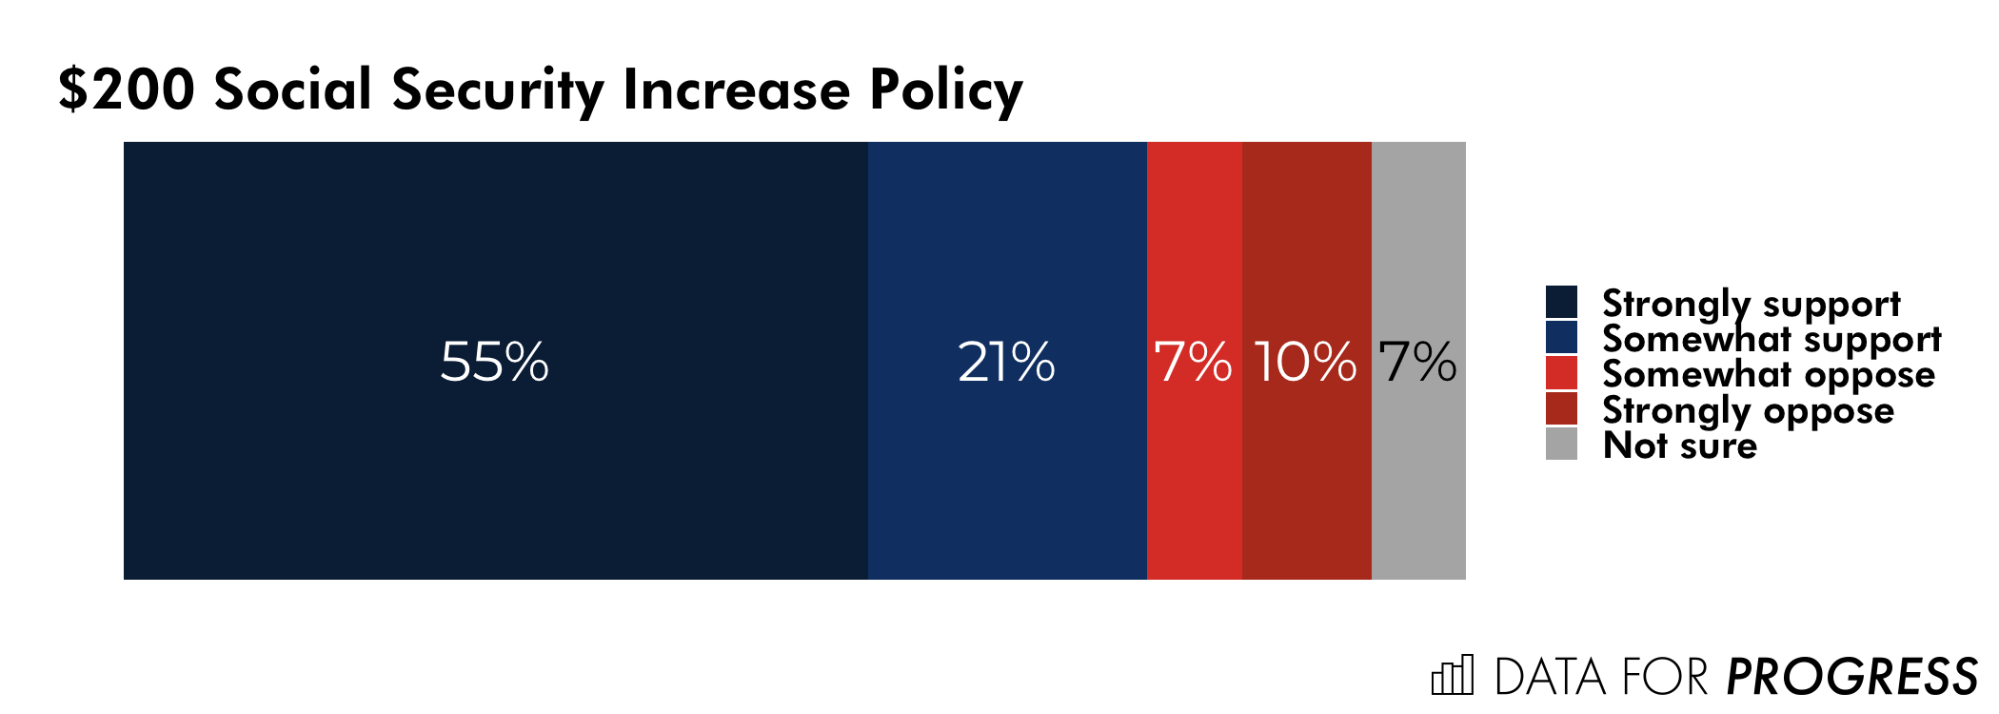
Would you [support or oppose] a proposal to increase the average monthly income for all Social Security beneficiaries by $200? This would be paid for by increasing payroll taxes on the richest 2 percent of Americans.
Overall, the survey found that 76 percent of those surveyed support the measure, with 17 percent opposing it and 7 percent not sure. (Throughout this post, some percentages might not sum to 100 exactly due to rounding.) This shows a broad consensus among Americans for the increased Social Security benefits that Warren’s plan outlines.
Further, the survey shows bipartisan support for the plan. Eighty-nine percent of those who identified as Democrats supported the measure, while 7 percent opposed it and 5 percent were not sure. A majority of independents supported it as well, with 70 percent supporting, 21 percent opposing, and 10 percent not sure. The measure was also very popular among those who identified as Republicans, with 67 percent supporting the measure, 26 percent opposing it, and 6 percent not sure.

We found broad support for Warren’s plan across every region of the country. Eighty-two percent of those registered to vote in the Northeast supported the measure, with 11 percent opposing it and 7 percent not sure. The West saw similar numbers: 78 percent supporting, 18 percent opposing, 5 percent not sure. Even regions generally seen as “red” endorsed the measure. In the South, 76 percent supported it, 16 percent opposed it, and 8 percent were not sure. And the Midwest saw 71 percent supporting it, 21 percent opposing it, and 7 percent not sure. Since not one sector of the country came in below 70 percent support, it is clear that Warren’s plan is wildly popular regardless of regional preconceptions.

Warren’s plan also proved popular in both rural and urban areas, despite the perplexing discourse suggesting the two don’t share political visions. In fact, the broadest support for the progressive plan was seen among those who reported being registered to vote in rural areas, with 82 percent supporting, 13 percent opposing, and 4 percent not sure. Those who reported living in towns supported the measure at 79 percent, with 14 percent opposing, and 8 percent not sure. Seventy-five percent of those who reported living in a city supported the measure, with 16 percent opposing and 9 percent not sure. And while the suburbs saw the weakest support, a majority still approved of the measure: 74 percent supported it, 20 opposed it, and 7 percent weren’t sure.

Democrats need not worry if the plan would hurt their chances of beating Trump; the survey shows broad support for it regardless of whom the respondents said they plan to vote for. If a respondent planned to support the Democratic Party candidate, whomever he or she might be, 90 percent support Warren’s plan, 6 percent oppose it, and 4 percent were not sure. Swing voters (i.e., those who said “it depends” who they’d vote for) also approved of the measure, with 70 percent supporting, 13 percent opposing, and 16 percent unsure. Even Trump supporters approved: 63 percent supported Warren’s plan, 31 percent opposed it, and 7 percent were not sure.

Although America may be more and more divided by education, Warren’s plan was widely supported regardless of education level. Seventy-seven percent of those who reported having a college degree supported the plan, while 19 percent opposed it and 3 percent were not sure. These numbers were similar to those who reported not having a degree: 75 percent supported the plan, 16 percent opposed it, and 9 were not sure.

Age didn’t deter support for the measure, either. Not one age group supported the plan at less than 67 percent. In fact, the youngest age group (those who identified being between the ages of eighteen and twenty-nine) supported the measure the least (67 percent), while 19 percent opposed it and 14 percent were not sure. The highest support (82 percent) was seen in two age groups: those who identified being between the ages of forty-five and fifty-four, and those who identified being between the ages of fifty-five and sixty-four. It is no surprise that shoring up Social Security finds its greatest support among those who are soon to (hope to) retire.

The overwhelming support for Warren’s plan makes two things very clear. First, when Republicans try to gut Social Security, they’re going against the will of not only the general public but also against that of their own base. And second, a progressive approach to Social Security is not a threat to electoral victory, but an advantage that may help Democrats win.
Methodology
This survey is based on 1,006 internet interviews of self-identified registered voters, conducted from September 13 through September 16, 2019, by YouGov Blue. The sample was selected and weighted to be representative of registered voters, and weighted according to gender, age, race, education, region, and past presidential vote based on registered voters in the November 2016 Current Population Survey, conducted by the U.S. Bureau of the Census. The weights range from 0.1 to 5.9 with a mean of 1 and a standard deviation of 0.5.
Andrew Mangan is a Senior Editor at Data for Progress and a writer living in Kansas City.
Mark White is a Senior Political Analyst at YouGov Blue and a Senior Adviser to Data for Progress.