Democrats Support Medicare for All
By Monika Nayak and John Ray
As the Democratic primary contest heats up between the top few contenders, the seemingly small policy differences that separate them will come into clearer focus. One of these differences is over healthcare policy. In a recent survey, Data for Progress implemented an experiment to randomly assign likely Democratic primary voters and caucusgoers to consider one of three possible healthcare policies. Each of these policies has at some point in the primary been the focus of at least one candidate.
Specifically, voters and caucus-goers saw one of three support/oppose questions for healthcare reform framing:
Would you [support or oppose] changing health insurance policy in the United States such that every U.S. citizen is enrolled in Medicare, abolishing private health insurance companies?
Would you [support or oppose] changing health insurance policy in the United States such that every U.S. citizen is enrolled in Medicare for basic insurance needs, retaining the option to buy additional coverage from private companies?
Would you [support or oppose] changing health insurance policy in the United States such that every U.S. citizen has the option to buy into Medicare instead of their current private health insurance plan?
Voters could report whether they strongly supported, somewhat supported, somewhat opposed, strongly opposed, or were unsure how they felt about the policy. Voters were randomly assigned to see one of the three proposals. With a sample of 1,619 voters randomly assigned to each policy, about 540 voters in each condition responded to the question.
Across the board, Democratic voters support some form of expanding access to Medicare. About 66 percent of Democratic voters who saw it supported enrolling every US citizen in Medicare and abolishing private health insurance companies and about 23 percent opposed it. Fully 80 percent who saw it supported enrolling people in Medicare for basic coverage with the option to buy additional private coverage versus 11 percent who opposed it, and about 75 percent supported creating an option to allow voters to buy into Medicare if they so chose compared to 12 percent who opposed it.

In other words, universal Medicare with private insurance being abolished enjoys net +42 percent support among Democratic primary voters. Universal basic coverage with additional private options enjoys net +69 percent support, and a public option enjoys +64 percent support.
While we only found a couple of statistically large differences within subgroups, we observed some marginal differences that are of interest even if the sample size constrains us from making inferences about the reliability of the estimate.We observed slightly higher support levels across the board from male. About 69 percent of men compared to 63 percent of women supported universal Medicare with private insurance abolished. About 84 percent of men and 77 percent of women supported universal basic coverage with the option for more private insurance. Just over 81 percent of men and 72 percent of women supported providing a public option.
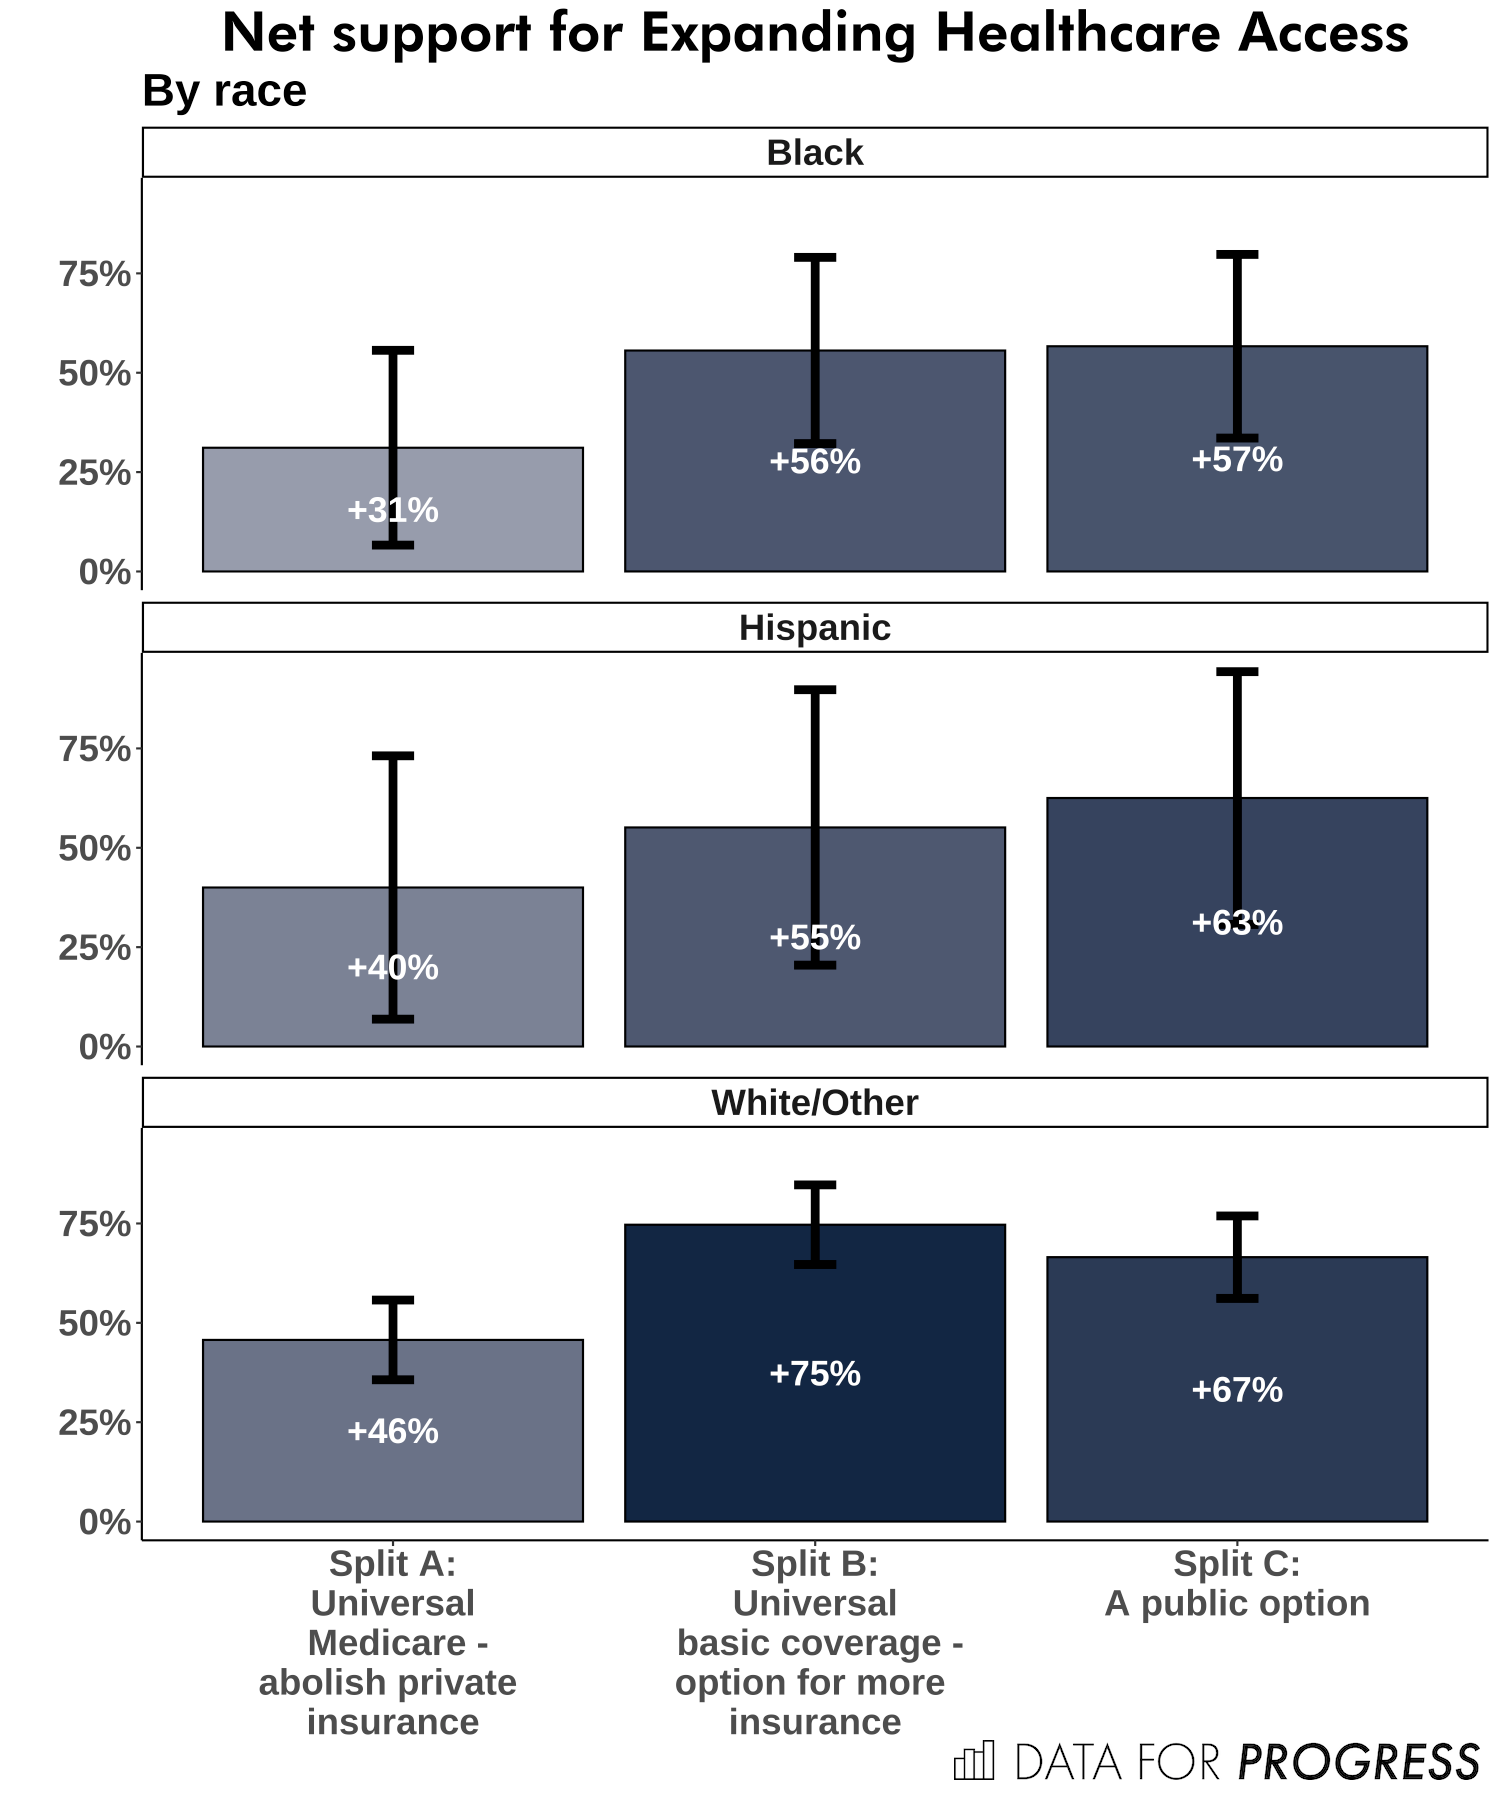
Additionally, white voters were marginally more supportive of expanding access to healthcare than were Black or Latino voters. About 53 percent of Black voters, 62 percent of Latino voters, and 70 percent of white voters supported universal medicare with private insurance abolished. About 69 percent of Black, 71 percent of Latino, and 84 percent of white voters supported basic coverage with a private option, with similar numbers (69 for Black voters, 73 for Latino voters, and 78 for white voters) supporting a public option that would compete with private insurance.
On net, we can see that Black, Latino, and white respondents all clearly favor expanding access to healthcare. While the smaller sample size prevents us from drawing firm conclusions, it is apparent that support for universal Medicare with private insurance abolished is lower. Among each group, support for universal Medicare with private insurance abolished is the least preferred of the three voters were randomly assigned to see.
Most notably, suburban voters are clearly more tepid in their support of providing Medicare for All than were voters who lived in other areas. Support for expanding healthcare access in each condition was clearly positive on net, but broken out this way, the sample size allows us to make statistically distinguishable conclusions about urban/suburban/rural voters.
Overall, fully 71 percent of urban voters supported universal Medicare, as did 75 percent of rural-area Democratic voters. That number was just 59 percent for universal Medicare among suburban voters, and accompanied 32 percent opposition, which is just under ten points higher than the overall sample average level of opposition. In other words, suburban voters drove opposition to universal Medicare coverage.

The net difference between support and opposition is significantly lower for suburban-area Democratic voters than it is for other kinds of healthcare reform. Indeed, while suburban-area voters drove opposition to universal Medicare, they drove support to basic coverage with the option of private supplements, with their level of support for the second treatment being a few points higher than the sample overall.

Democrats are ready for healthcare reform. Within that, however, there is significant variation in what kinds of reforms voters are willing to accept. White voters are more supportive of reform overall, and suburban voters are particularly tepid on the subject of universal Medicare provision. While Democrats clearly have room to call for new healthcare reforms, it is worth noting that reforms which preserve at least some private options are clearly favored over a policy that would not.
Monika Nayak is a political analyst at YouGov Blue.
John Ray is a senior political analyst at YouGov Blue
Footnotes
This survey is the second wave of a larger project on Democratic primary voters. The first included 2,953 interviews conducted from June 24th to July 2nd, 2019 by YouGov on the internet of registered voters likely to vote in the Democratic presidential primary in 2020. A sample of 6,116 interviews of self-identified registered voters was selected to be representative of registered voters and weighted according to gender, age, race, education, region, and past presidential vote based on registered voters in the November 2016 Current Population Survey, conducted by the U.S. Bureau of the Census. The sample was then subsetted to only look at respondents who reported they were likely to vote in their state’s Democratic primary or caucus. The second wave included 1,619 interviews based on recontacting respondents participating in the first wave (a 55% recontact rate). Respondents participated from January 18th to January 27th, 2020.
In the charts presented here, some of the “support minus oppose” quantities may differ from their apparent arithmetic values by 1 percent due to rounding.