The Tech Behind Data for Progress: Keeping Records of Everything
By Jason Katz-Brown, Erin Thomas, Jamie Kowalski, Charlotte Scott, Cecilia Bisogno, and Johannes Fischer
Political leaders don’t trust their pollster because they’re the best at math or have the fanciest technology. Pollsters develop trust as they build a track record of accuracy, political acumen, and commitment to their values. To achieve this at Data for Progress, our ethos is that Everyone Is a Pollster: no matter your role or tenure at DFP, you are empowered to run a poll from start to finish.
From this framing, the goal of the Data for Progress Tech Team is clear: build platforms that enable every member of staff to run a survey from sampling to fielding to weighting to charting to publication. We’re proud to give a behind-the-scenes look at how we’ve set this up. The tenets of our engineering work are threefold:
Keep records of everything
Never copy and paste a number
All staff has as much access to platforms and data as possible, with built-in guardrails and documentation to ensure best practices
In this first installation, we’ll look at a guiding principle: Everything leaves a verifiable record.
Where’d This Result Come From?
Let’s start from a DFP poll result in the wild — this lovely tweet!
Nearly all voters — including Republican voters — oppose privatizing Social Security.
— Social Security Works (@SSWorks) February 13, 2023
But Republican politicians don't care.
They want to hand over our earned benefits to their Wall Street donors. #DontMessWithSocialSecurity @DataProgress pic.twitter.com/j9BnJC9eJb
We might wonder, what survey is this from? How was it fielded or weighted? At any given time, Data for Progress is running multiple surveys across different geographies and modes, and any given deliverable can go through many iterations by our staff and partners. Let’s take a look at how we can work backward from a final deliverable to the underlying survey data.
To ensure we can precisely trace our delivered results all the way back through our processes, we automatically fingerprint the charts and PDFs we produce. If we zoom way into that chart, we can find the (small! gray!) fingerprint:

We can take this fingerprint to Webapp for Progress, our platform for fielding and analyzing all surveys Data for Progress has ever run. Let’s search for ‘VPYTRY’...

Webapp for Progress takes us to the precise survey and report.

This surfaces reports run by team members Sabrina and Lew, of which Lew’s is the precise one published. Each report defines a set of PDF crosstab and PNG chart deliverables. Reports are configured with a Google Sheet, which we can look at with the ‘config’ link:

This says we want to make charts of three questions, in particular of ‘dfp_comms_topline_social_security_privatization_merged’ with title “Across Party Lines, Voters Oppose Privatizing Social Security,” with breakdowns by partisanship and “Experience With Social Security.” We can also take a closer look at the weight specified, ‘dfp_weight_midterm’, by looking at Webapp’s record of weights we’ve computed for this survey:

‘dfp_weight_midterm’ is our default weight for national samples representing the 2022 midterm electorate. You can see additional weights we automatically compute for surveys, like ‘dfp_weight_adults’ (useful for weighting to the demographics of American adults as opposed to just likely voters). For each weight, Webapp records various diagnostics, like the targets, marginals, design effect, highest-weighted respondents, and git hash of the codebase at the time of weighting.
The process to import a survey into Webapp is also fully automated. After a survey is imported, we can find its “output artifacts” next to its name in the import log:
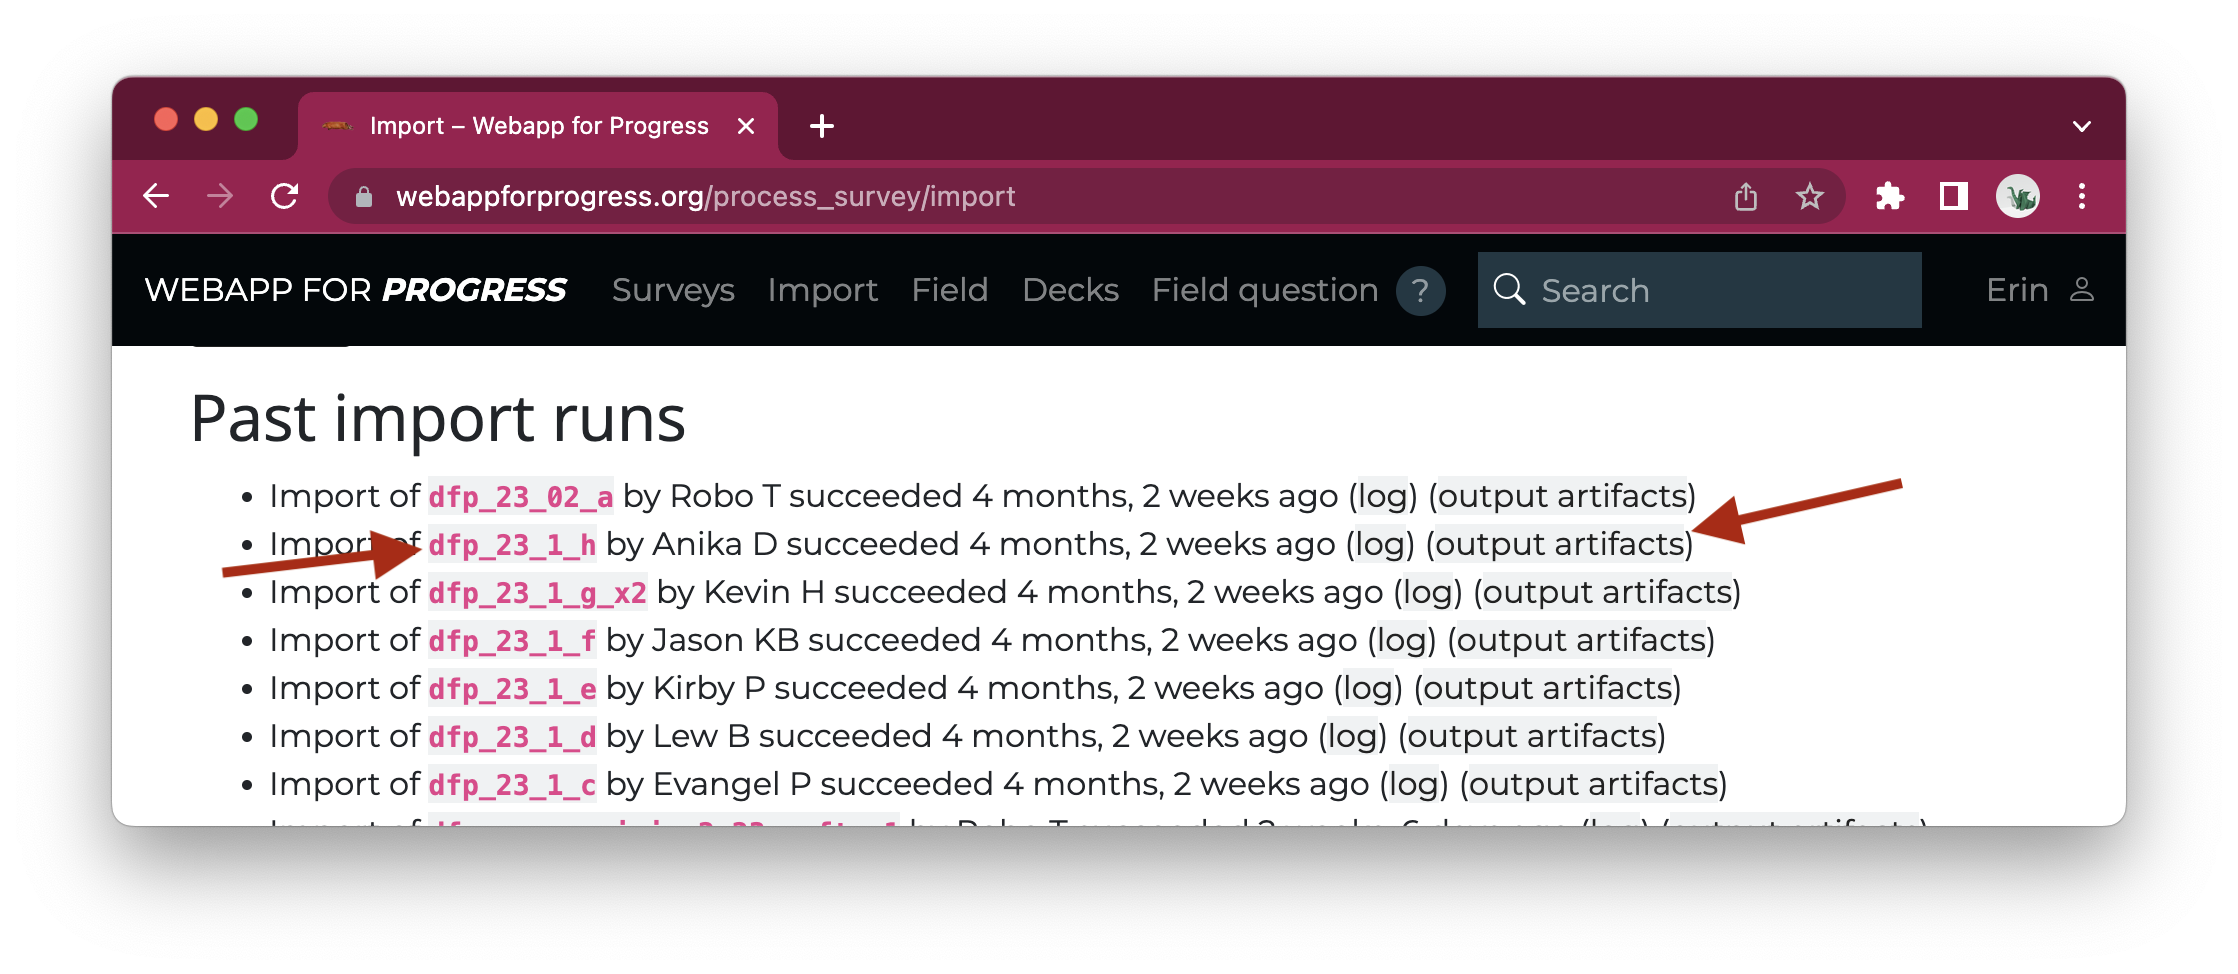
This allows us to download the raw and intermediate data that are part of survey import, like ‘qualtrics_data.csv’ (the raw per-respondent data we get from the Qualtrics API).

Never Delete
The last key to keeping records of everything is to never delete data. Webapp (or any of our tools) has no mechanism for deleting survey responses, weights, or reports. The scenario above is a good example: We identified a set of respondents who should not be included in final results, but instead of deleting them, we zero them out during weighting and make a note of this in the immutable log associated with that weight.
Sometimes not being able to delete an old version of something is inconvenient — it can take a few iterations to get enough respondents in your sample or to find a representative weight — but this is outweighed by not having to worry about irretrievably messing something up. And we’ve built in mechanisms to archive the clutter of old versions of surveys and reports.
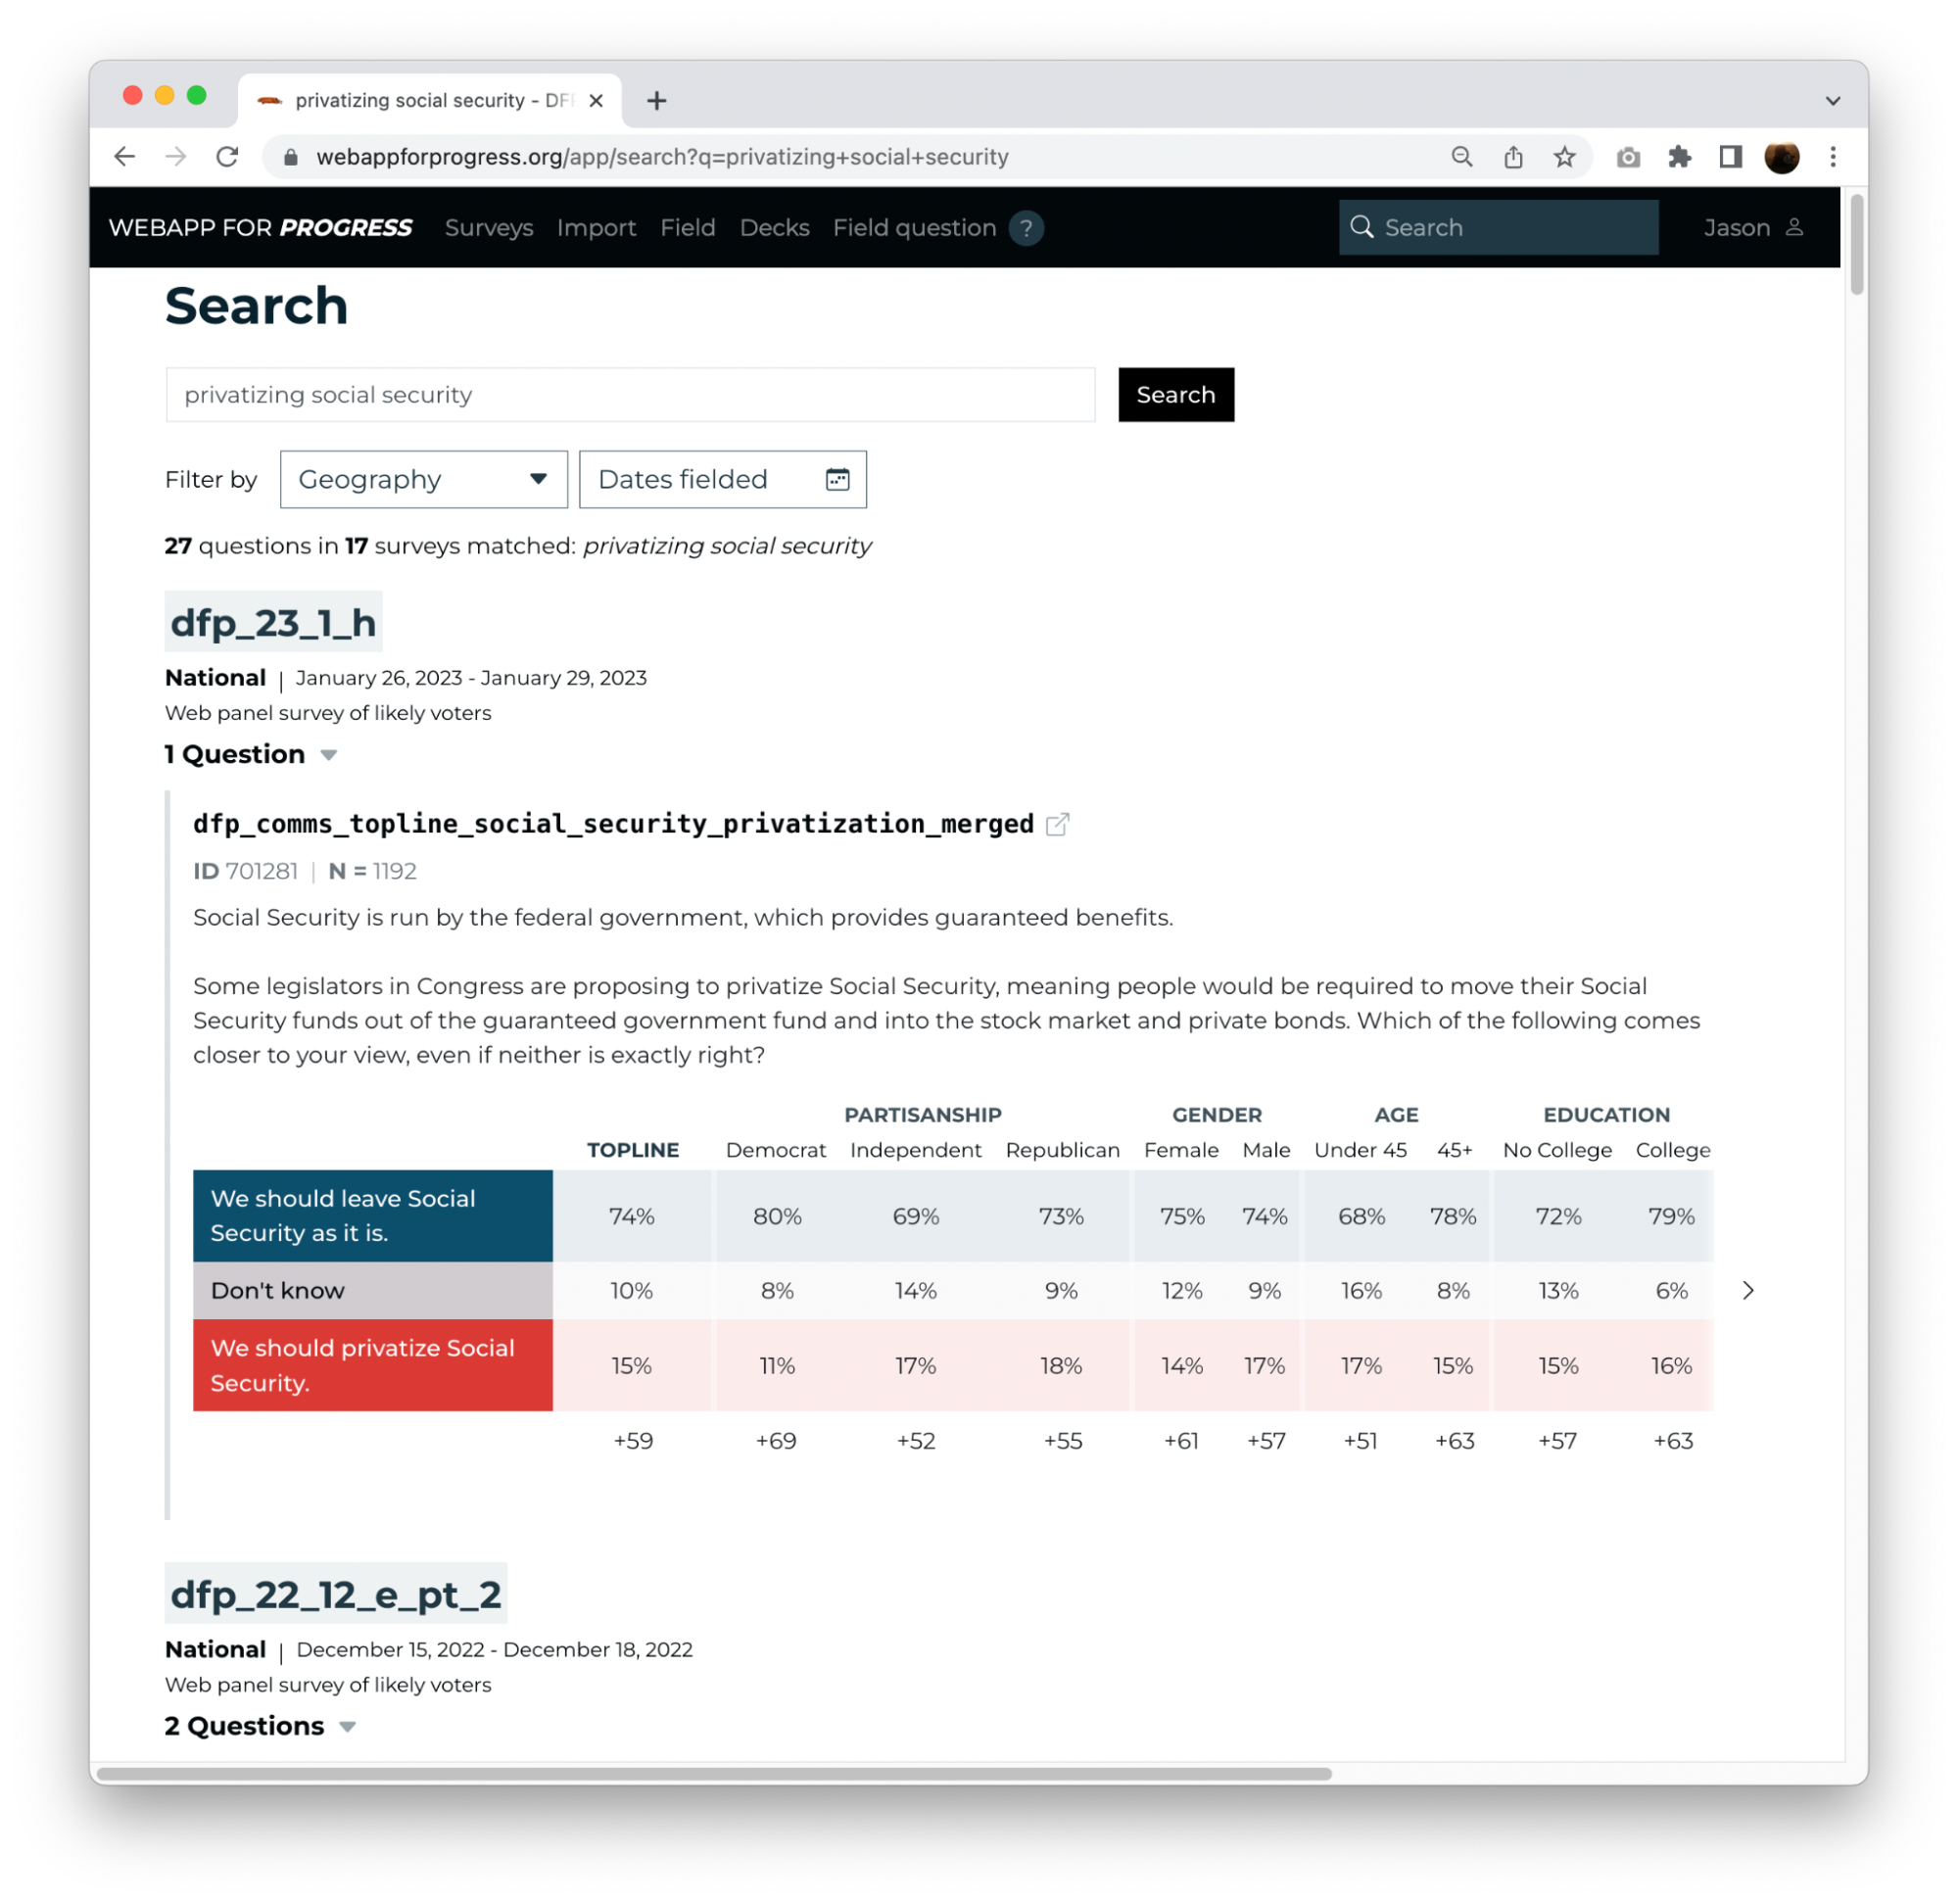
Search!
Our search doesn’t just work over fingerprints; keeping all our surveys and results in one database lets us offer full-text search over everything we’ve ever asked. For example, we can search for “privatizing social security” and find the 17 surveys we’ve run on this topic, the most recent of which is the one behind the tweet above.
Keep Records of Everything
So that’s it, our first engineering tenet: Keep records of everything. We’re proud that every member of staff can run a survey from sampling to fielding to weighting to charting to publication and be confident that our tools will support them each step of the way, from record-keeping to ensure that nothing is lost to time, to answering the age-old question, “Who made that chart?”
Jason Katz-Brown (@jasonkatzbrown) joined Data for Progress as CTO in 2020 and now serves as a senior advisor.
Erin Thomas is the Tech Director at Data for Progress.
Jamie Kowalski is a senior software engineer at Data for Progress.
Charlotte Scott is the Fielding Manager at Data for Progress.
Cecilia Bisogno is the Methodology Engineer at Data for Progress.
Johannes Fischer (@pollhannes) was Director of Analytics and Engineering at Data for Progress and now serves as a senior advisor.
Special thanks to Pierre Gergis, Colin McAuliffe, Daniel Bravo, Evelyn Ting, Jason Ganz, Nic Fishman, and Ben Rahn, each of whom contributed significant engineering.