DFP Coronavirus Response Tracking Poll Week 4
By Brian Schaffner and Laurel Bliss, Tufts University
Summary
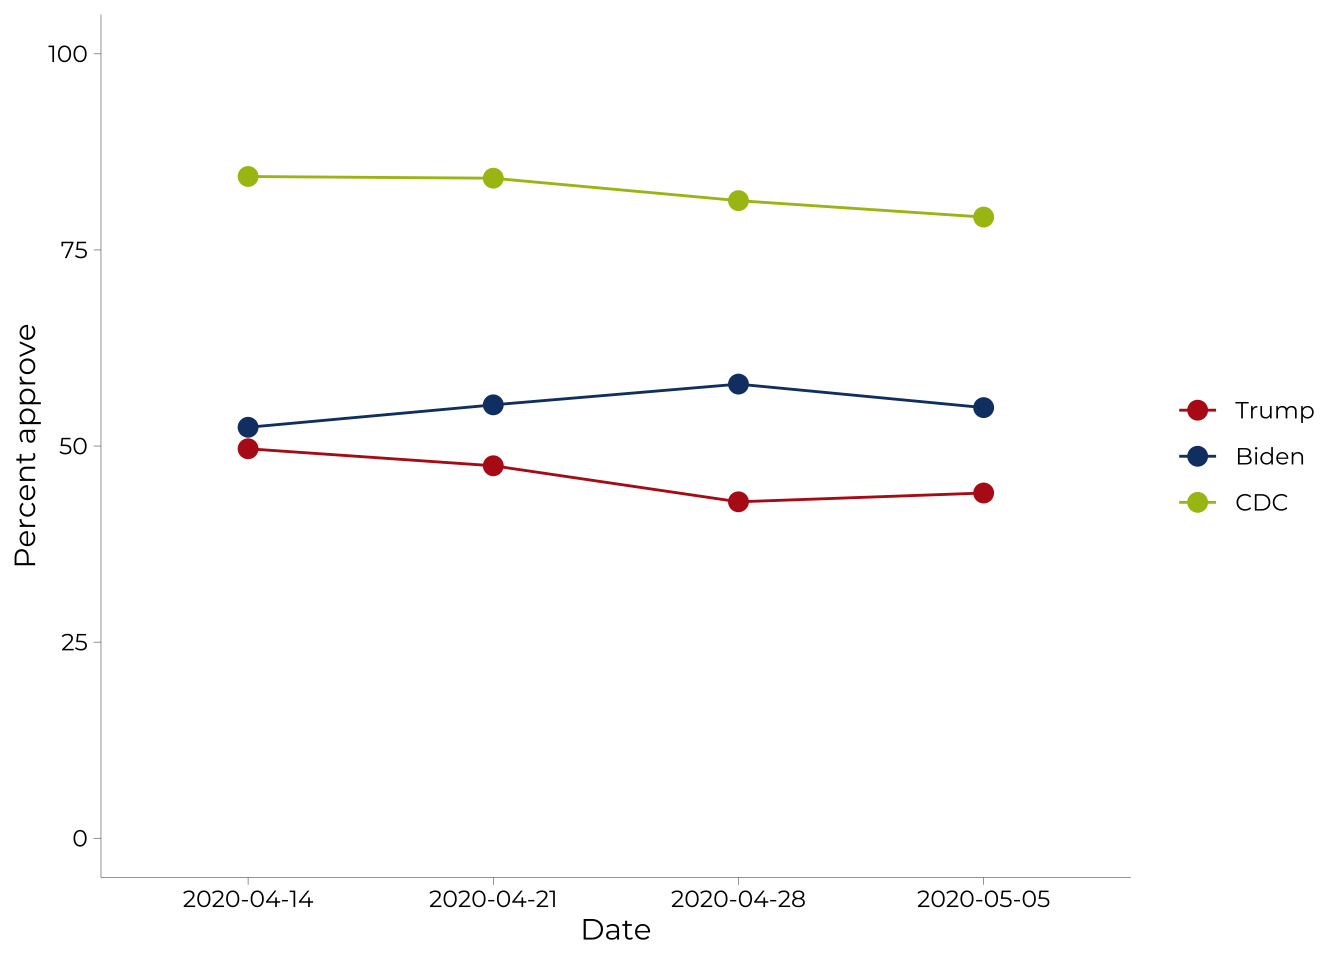
As states begin to reopen, respondents’ opinions on and responses to coronavirus are shifting. Support for Donald Trump, Joe Biden, and the CDC remains similar to last week, but has changed significantly since week one. Seventy-nine percent of respondents say they somewhat or strongly approve of how the CDC has handled the Coronavirus pandemic, a 6 percentage point drop since week one. Approval of Donald Trump has dropped 6 percentage points since week one, leaving him with 44 percent of respondents supporting his handling of the pandemic Support for Joe Biden’s has remained relatively constant over the last few weeks and currently 55 percent of respondents approve of how he has handled coronavirus.
Respondents increasingly say they have more trust in their own state government to handle the coronavirus pandemic than the federal government. This week, 68 percent of respondents said they trust their own state government more than the federal government. This gap has increased by 9 percentage points since April 14th.
Fewer respondents are reporting that they have lost their jobs but continue to report that their hours have been cut. Twenty-four of respondents have had their hours reduced and 17 percent have lost their jobs. The decrease in jobs lost in the last two weeks may be due to some people heading back to work, but people who are working continue to report having their hours cut. In the past week, there was an 18 percentage point increase in respondents reporting that they have received their stimulus checks with the total now at 59 percent. This increase was accompanied with a 7 percentage point downtick in respondents who say that support has been distributed too slowly, leaving 50 percent of people who still hold this belief.
In the last week, there has been a significant change in behavior in response to the coronavirus. There was a decrease in people who said they were not socializing at all or socializing online and an increase in people socializing in public and socializing at homes of friends and family. These changes are likely due to the steps some states have taken to begin to re-open. Seventeen percent of respondents are now socializing in public, a 5 percentage point increase since April 14th. Eighteen percent of respondents are now socializing at the homes of friends and family (a 3 percentage point increase since April 14th). Similarly, fewer people are choosing to exclusively socialize online or not socialize at all.
Support for the CARES Act remains high, but slightly lower than it once was. The CARES Act still receives overwhelming support, but support is 8 percentage points lower than it was on April 14th, now at 78 percent. Support for increasing spending despite the deficit has also decreased since April 21st, when this question was first included, from 66 percent to 58 percent on May 5th. Similar patterns of support appear for provisions that Americans would like to see in the next aid legislation. Again, support remains at over 50 percent for every policy we asked about, but a few items have seen drops in support since last week. Support for universal paid sick and family medical leave has dropped 6 percentage points to 64 percent. Direct cash transfers to Americans also had a drop in support from 69 percent to 63 percent. Other policy proposals retained support from last week.
Approval on handling of coronavirus pandemic
The graph below shows the percent who strongly or somewhat approve of how Donald Trump, Joe Biden, or the CDC are handling the coronavirus pandemic. Respondents who responded “not sure” were excluded from the analysis.
Question wording: “For each person or group, say whether you approve or disapprove of the way they are handling the coronavirus pandemic:”
Which level of government do you trust more to handle the Coronavirus pandemic: The [R’s state] state government or the federal government?

Changes in job status
Here we track responses to a question asking respondents how their work has changed since March 1st of this year. Only respondents who are in the workforce are included in the chart below.
Since March 1st of this year, has your work changed? Yes, my hours have been reduced. Yes, I lost my job.

Social Distancing
Question wording: Which of the following best describes your current behavior?
I am continuing to socialize in public places
I am continuing to socialize in public places, but slightly less than before
I am not going to public places, but I am socializing with friends or family in my or their homes
I am not going to public places, but I am socializing with friends or family virtually I am not going to public places nor am I socializing with family or friends

Government response to Coronavirus
In this section, we show how Americans are evaluating what the government has done to address the Coronavirus pandemic and how much they still want the government to do.
Question wording: Based on what you have heard, do you support the “Coronavirus Aid, Relief, and Economic Security Act” or CARES Act?

Question wording: Have you received a check or direct deposit as part of the federal government’s stimulus bill (the CARES Act)?
The recent stimulus package (CARES Act) mandated the distribution of financial support for individuals and small businesses. Do you think the government has distributed this financial support…?

Question wording: Do you think the government should spend more money to address the coronavirus pandemic and its economic impacts, or do you think the government has already spent enough?

Question wording: Which comes closer to your view?
The government needs to spend more to address the coronavirus pandemic, even if it means increasing the national debt and deficit
The government has spent enough to address the coronavirus pandemic and should not do anything else to increase the national debt and deficit
The government has spent too much to address the coronavirus pandemic and should cut spending to reduce the national debt and deficit

Question wording: Would you support or oppose the following provisions in a future legislative package to address the coronavirus pandemic:

General scope of government
Here we track Americans' views on the scope of government.
Question 1 wording: Some people think the government should provide fewer services even in areas such as health and education in order to reduce spending. Suppose these people are at one end of a scale. Other people feel it is important for the government to provide many more services even if it means an increase in spending. Suppose these people are at the other end. Where would you place yourself on this scale? 1=Provide fewer services. 7=Provide many more services.
Question 2 wording: Some people feel the government in Washington should see to it that every person has a job and a good standard of living. Suppose these people are at one end of a scale. Others think the government should just let each person get ahead on their own. Suppose these people are at the other end. Where would you place yourself on this scale? 1=Govt should let each person get ahead on own. 7=Govt should see to jobs and standard of living.

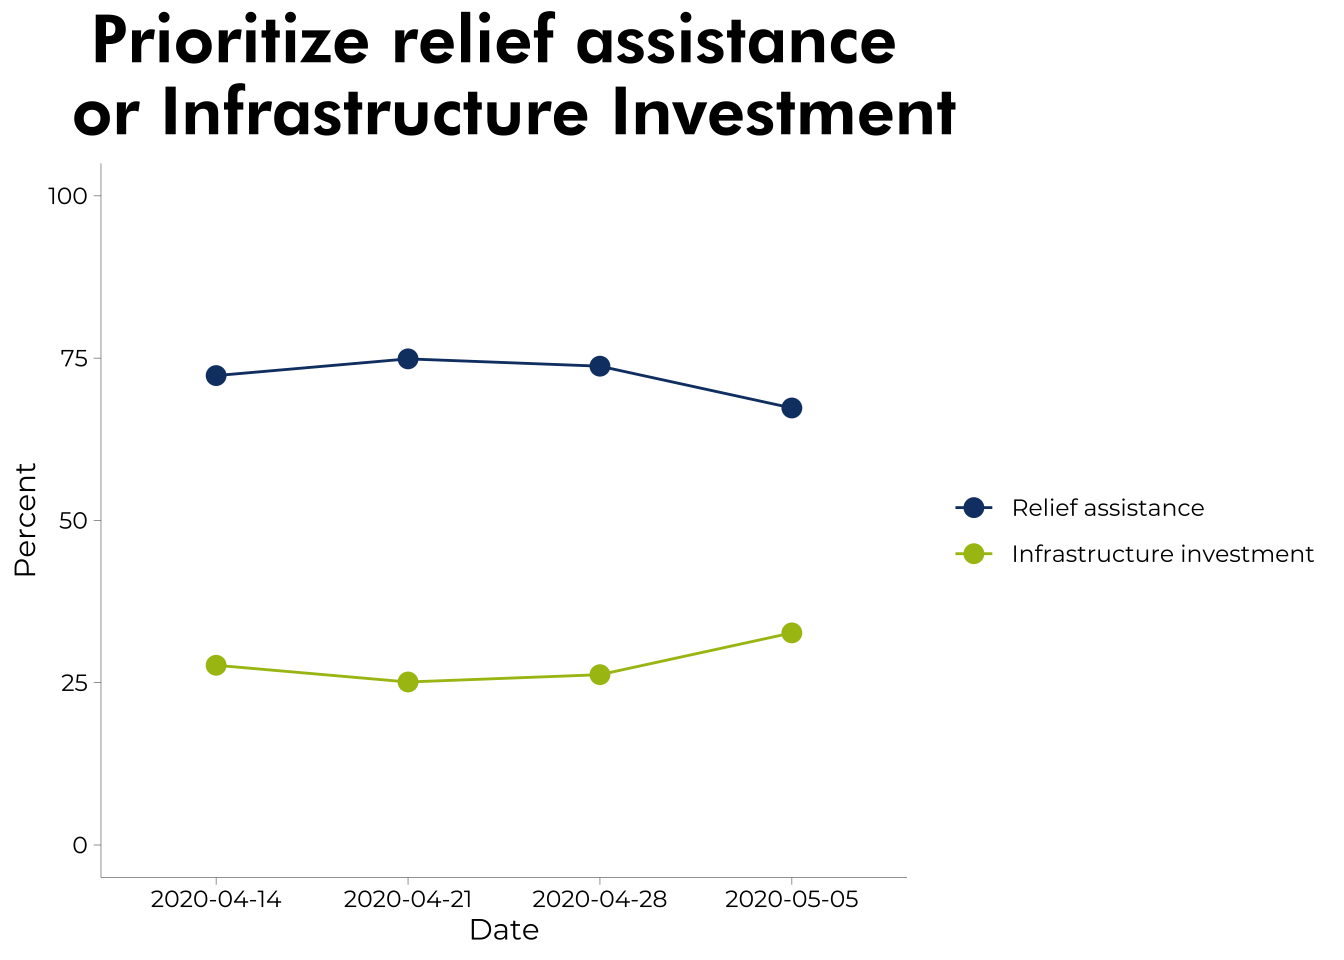
Question wording: Do you think that the government response right now should mostly be focused on: Relief in the form of assistance to workers and small business OR Investments in new infrastructure to get Americans back to work.
Question wording: Would some form of socialism be a good thing or a bad thing for the country as a whole? (Remaining respondents selected “no opinion”)

Methodology
The Data for Progress COVID-19 tracking poll is fielded each week using respondents recruited via Lucid. Post-stratification weights are implemented to make each week’s sample nationally representative of American adults by gender, age, region, education, race, and the interaction of education and race. The margin of error for each week’s survey is approximately ± 3.7 percentage points (this is a conservative estimate and will vary slightly depending on the exact sample size and design effect each week).
Full Toplines and Crosstabs
A document showing toplines by survey wave for each question can be found here.
The raw data for the tracking poll can be found here.
Crosstabs for each week’s poll can be found at the links below: